The restaurant and foodservice industry is one of the largest in the United States, both in terms of its economic impact and the number of people employed—1 in 10 people work in the industry, which generates 2.5% of the United States’ GDP.
Want to take a deeper dive into this crucial sector of the economy? Let’s take a look at the numbers.
Restaurant and Foodservice Industry Size
Restaurant and Foodservice Industry Sales
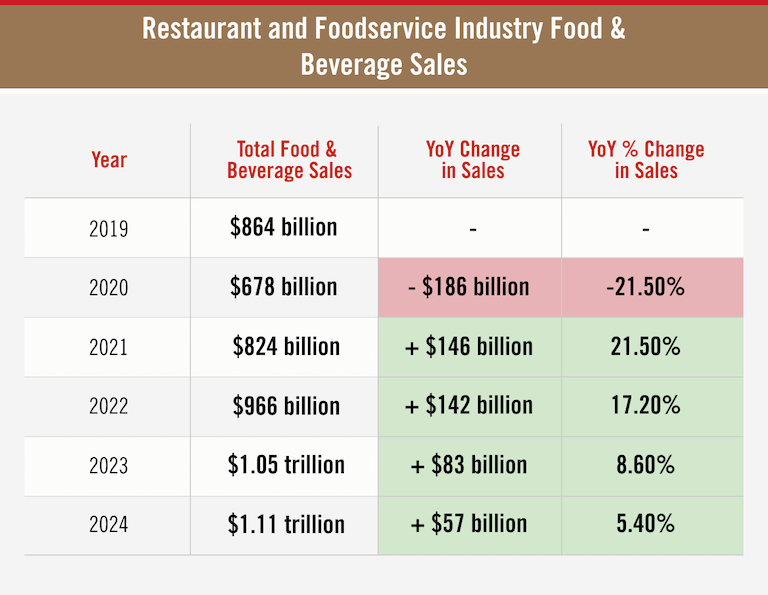
Like many industries, the restaurant and foodservice industry has changed a lot since 2020, the industry’s resilience has been on display as total food and beverage sales quickly returned to and have now exceeded pre-pandemic levels.
(source)
Foodservice Industry Contribution to United States GDP
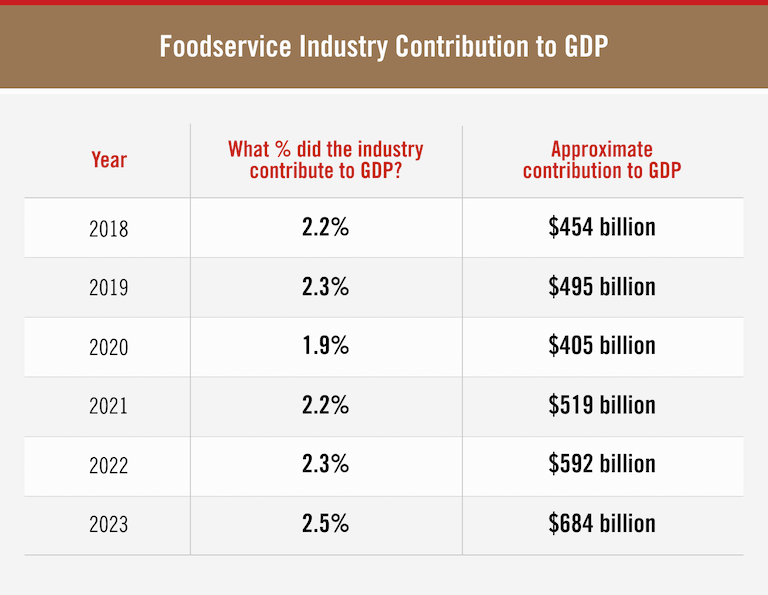
Escoffier reviewed data from the U.S. Department of Commerce’s Bureau of Economic Analysis (BEA) and found that the foodservice industry sector made up 2.5% of the nation’s GDP in 2023—approximately $684 billion.
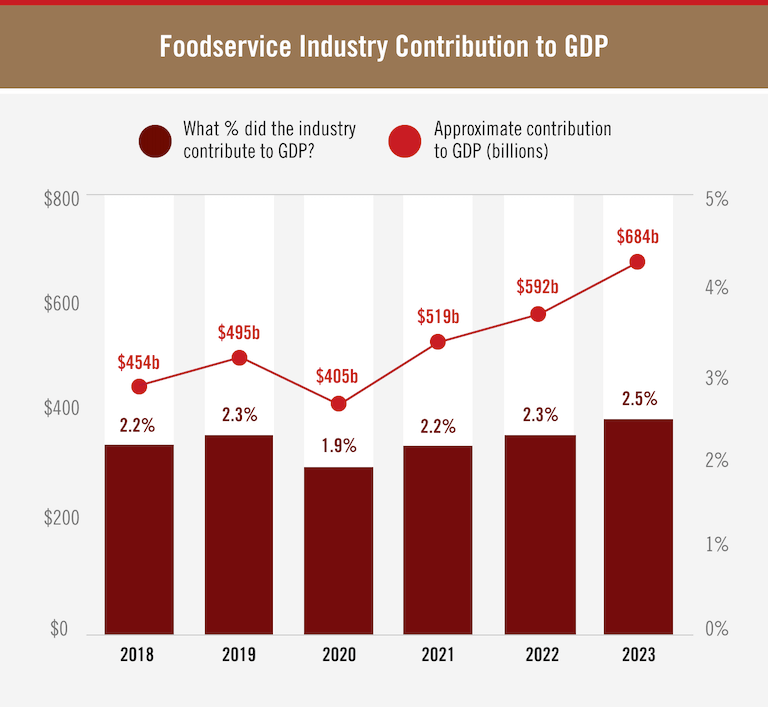
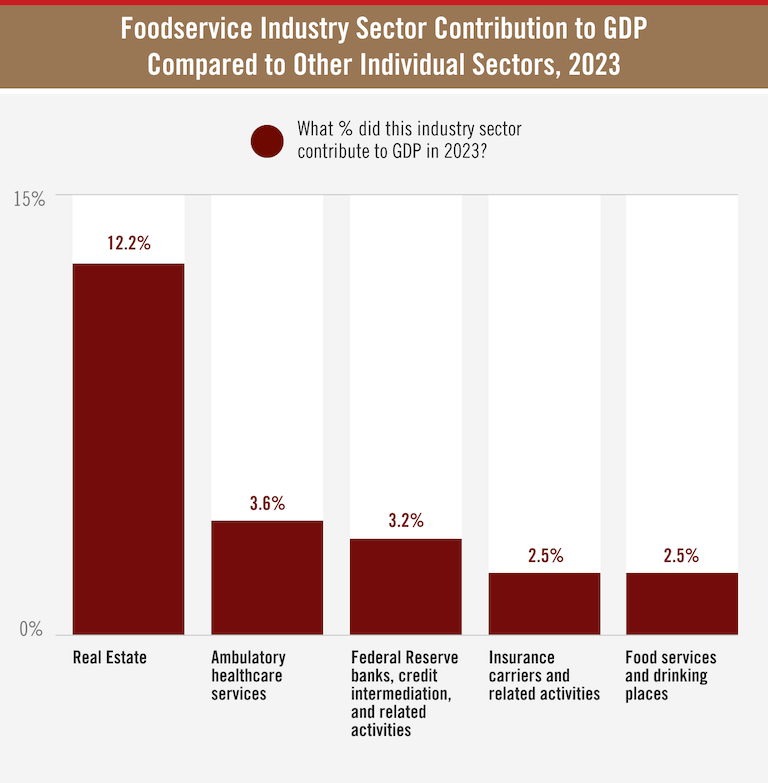
While 2.5% may not sound like a huge contribution at first, this is actually one of the top-contributing individual sectors of the entire U.S. economy, only ranking below other major contributors like real estate—which, at 12.2%, is by far the largest—and ambulatory health services at 3.6% (which includes non-hospital health services, like doctor’s offices, diagnostic labs, and home health care).
Foodservice Industry Market Size
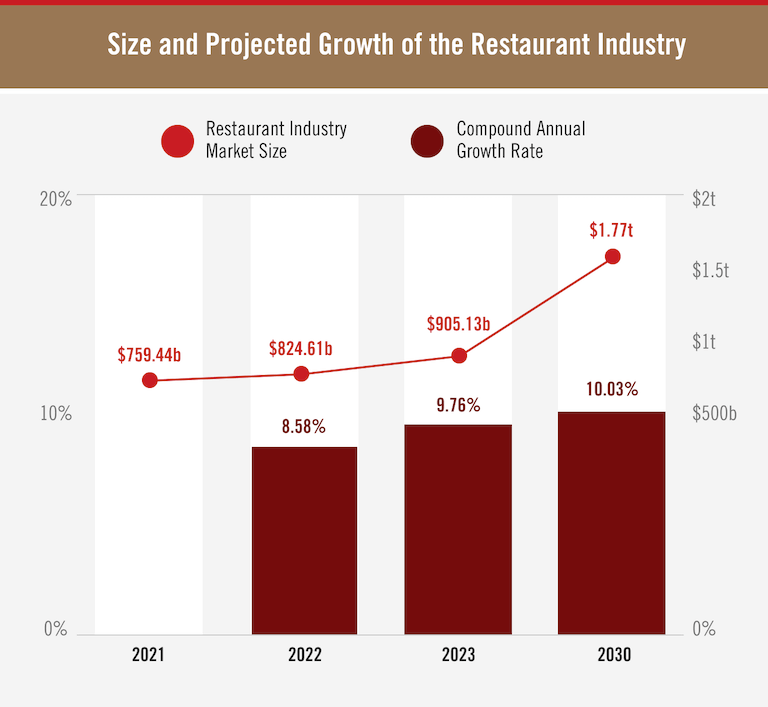
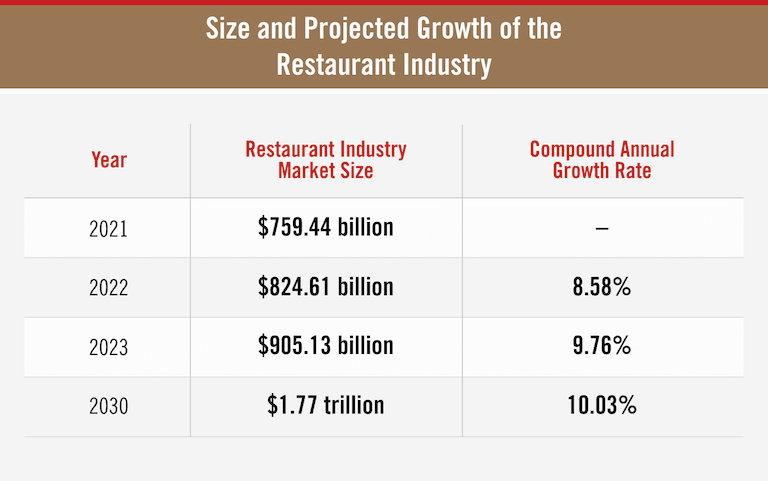
In 2023, the foodservice industry’s market size was $905.13 billion. This marked a 9.76% increase over the previous year.
Not only is the industry’s market size expected to continue to grow—almost doubling by the year 2030, when it is projected to reach nearly $1.8 trillion—but it is expected to grow faster than it has in recent years, at an annual rate of 10.03%.
(source)
Current Number of Restaurants, by Type
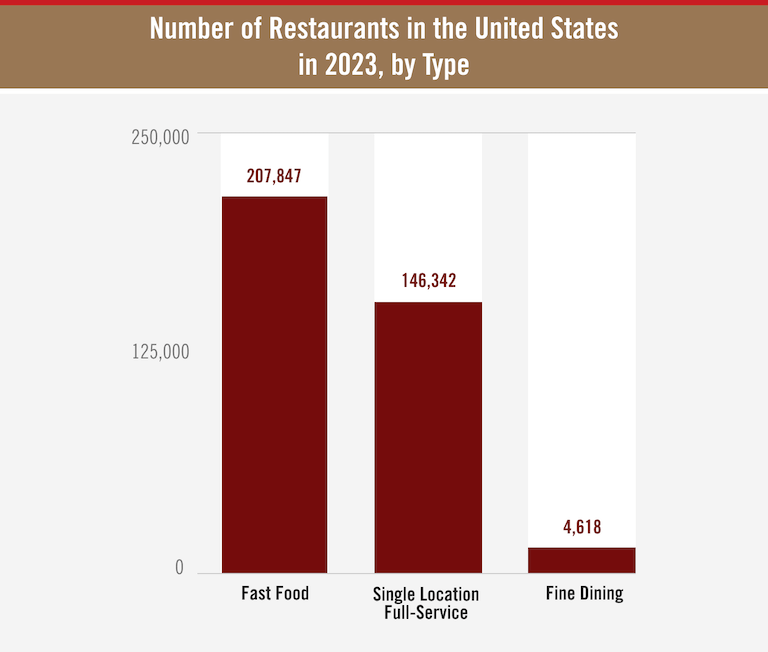
The number of restaurants in the United States is increasing—although some types of restaurants are growing faster than others.
In 2023, there were 200,859 fast-food restaurants in the United States—up 0.8% since 2022.
Single-location full-service restaurants (that is, independent restaurants, as opposed to chains) grew at a slightly slower rate; in 2023, there were 146,342 restaurants of this type in the United States, up 0.6% since 2022.
Fine dining restaurants grew at a rate of 0.3% from 2022 to 2023; there were 4,618 fine dining restaurants in the United States in 2023.
Restaurant and Foodservice Employment Statistics
1 in 10 people work in the restaurant and foodservice industry, meaning this industry is the second-largest private sector employer—behind only the healthcare industry.
Current Restaurant and Foodservice Industry Employment
The industry is projected to add some 200,000 jobs from 2023 to 2024—an increase of 1.3%; by 2032, the industry is projected to add an additional 1.2 million jobs.
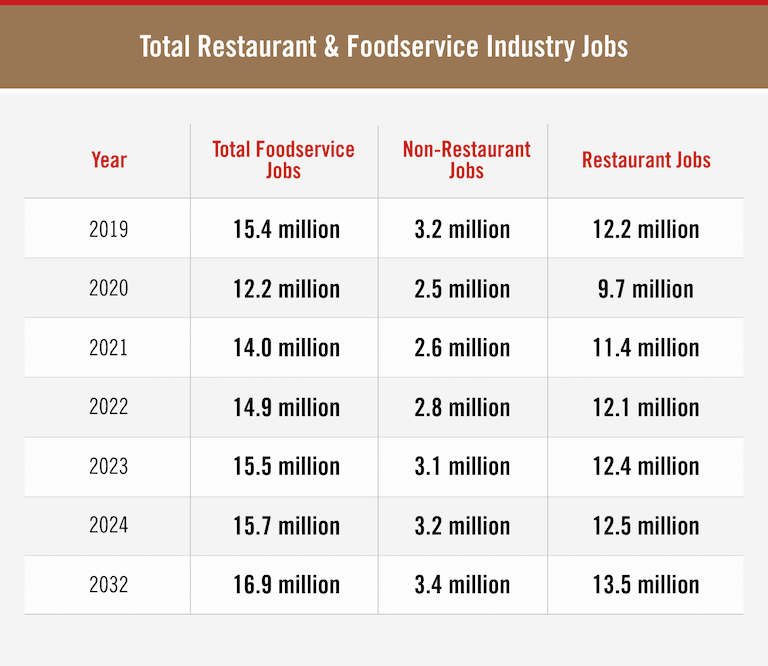
(source)
From the chart above, you can see that total food service jobs are broken into two broad categories: Restaurant Jobs and Non-Restaurant Jobs. The former is self-explanatory, while the latter refers to people employed in the food service industry at businesses other than restaurants, such as hotels, hospitals, or entertainment venues.
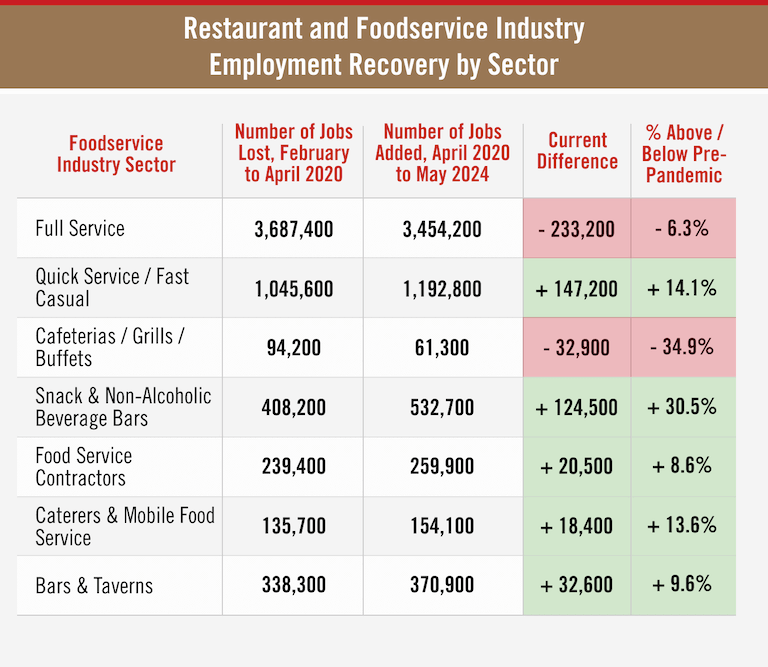
While the overall industry has surpassed pre-pandemic employment levels, the recovery has not been equal for all sectors of the industry.
Full-service restaurants are still 233,200 jobs below pre-pandemic levels—a contraction of 6.3%.
On the other hand, quick service / fast casual restaurants have added 147,200 jobs—an increase of 14.1% from pre-pandemic levels.
The sector that has contracted the most is Cafeterias / Grills / Buffets, which is still 32,900 jobs below pre-pandemic levels—a contraction of 34.9%.
(source)
Job Growth by Restaurant and Foodservice Industry Position
We’ve talked about how employment in the restaurant and foodservice industry is growing and changing; now let’s get a little more specific and look at the types of jobs in the industry.
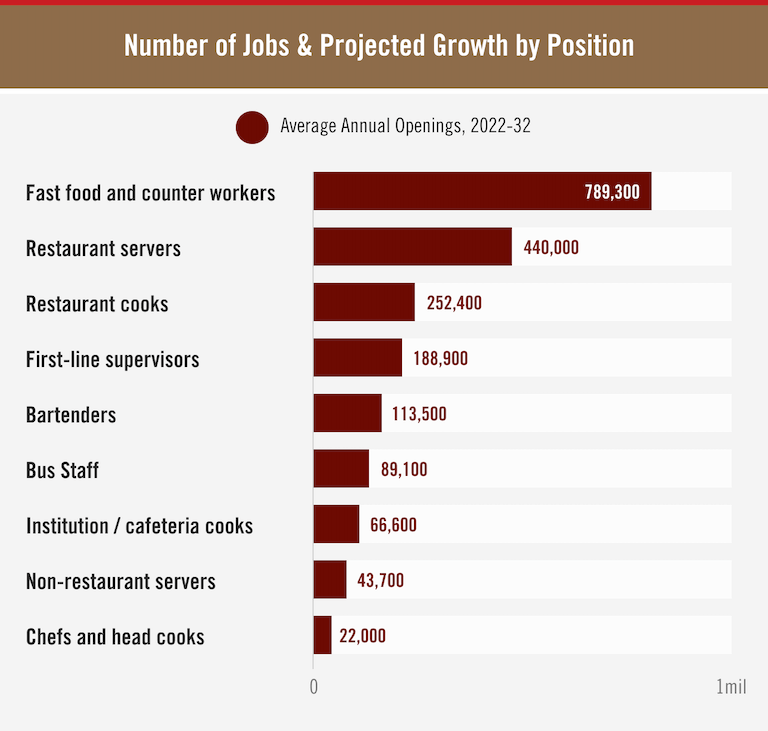
According to the U.S. Department of Labor’s Bureau of Labor Statistics (BLS), as of 2022, there were 3,410,100 people employed as fast food and counter worker jobs, and there’s an average of 789,300 of these jobs available every year, making this the most common position and the position with the most openings out of all positions in the restaurant and foodservice industry.
However, this position is only expected to grow by about 1.5% between 2022 and 2032. Restaurant cook is the position expected to grow most between 2022 and 2032, growing 20.4% in that time.
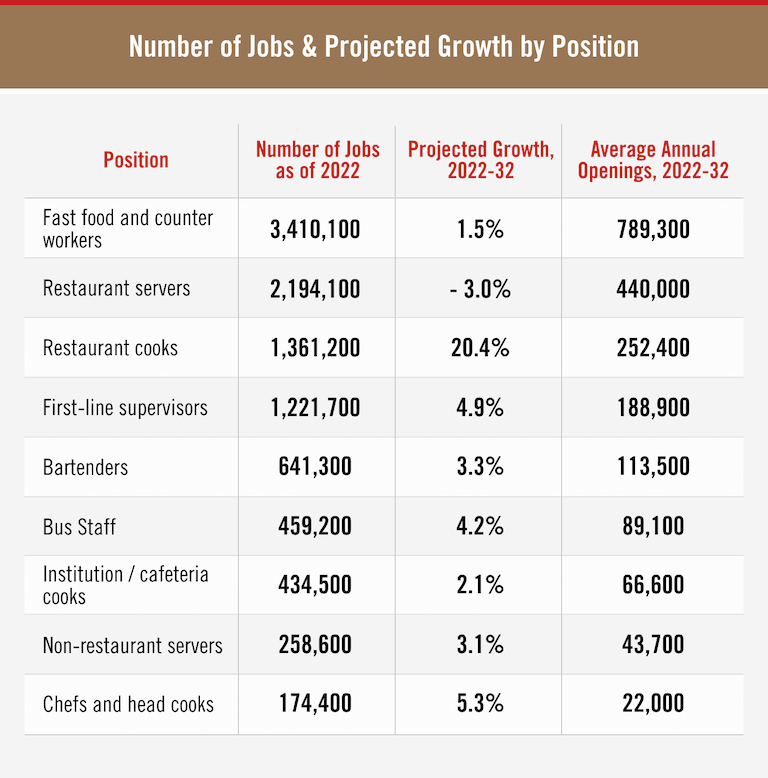
And in that same time frame, the total number of restaurant server jobs is expected to decrease by 3%. But even with that decline, because of turnover in the position, there are still expected to be an average of 440,000 openings each year—second highest of nine major positions.
Restaurant Staffing Shortage Statistics
As we mentioned before, even though hiring is increasing across the overall industry, that hasn’t necessarily been the case for every type of business within the industry. And restaurants are still experiencing a staffing shortage. In fact, in 2024, 45% of restaurant operators said their restaurant doesn’t have enough staff to meet demand—and almost 6 in 10 (57%) restaurant operators said they were more than 10% understaffed.
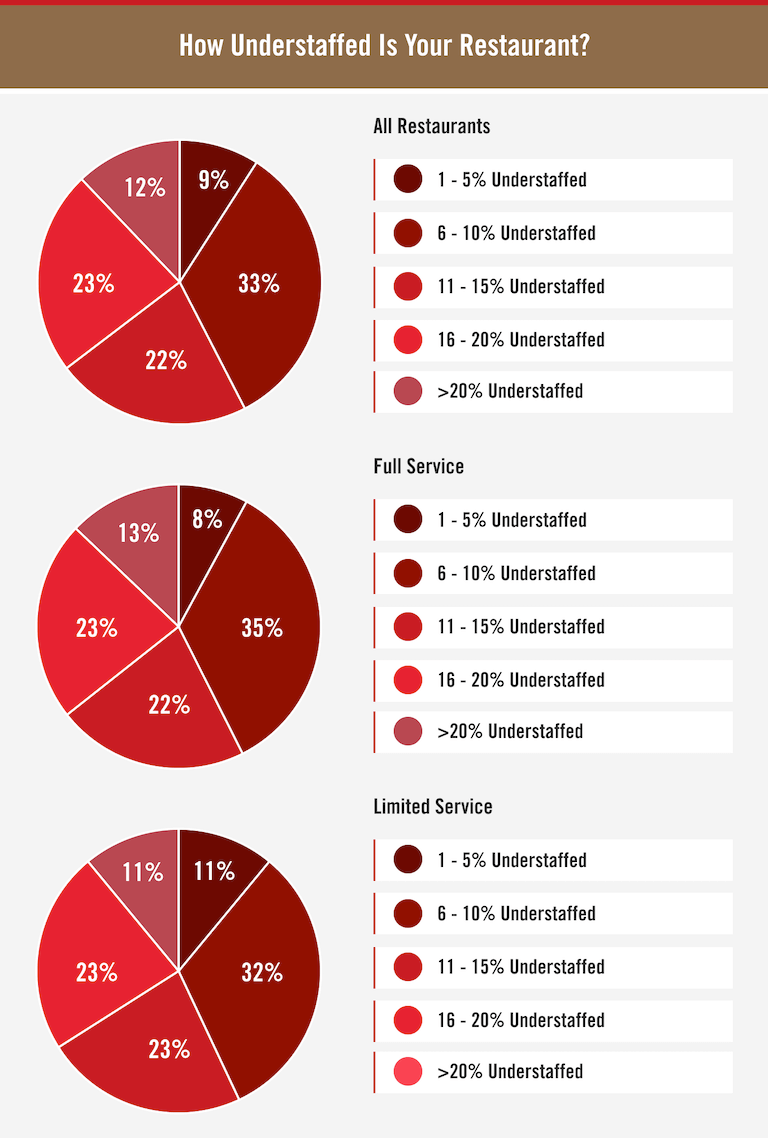
(source)
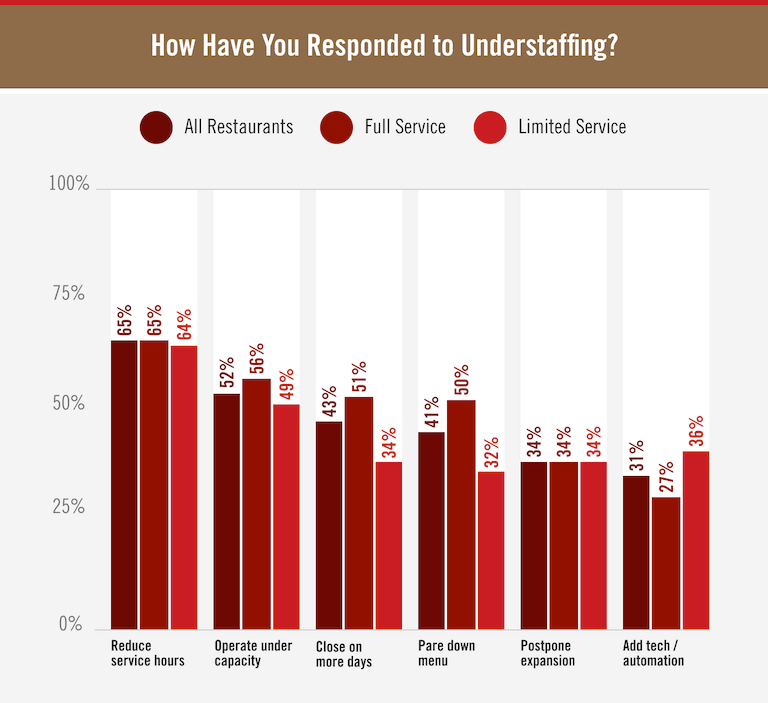
Many restaurant owners have had to take action to deal with a shortage of employees. Reducing service hours was the most common response to understaffing, with 65% of restaurant owners saying they had done so.
The next most common responses to understaffing were operating under capacity (52%), closing on days they would normally be open (43%), and paring down their menus (41%).
(source)
Restaurant Turnover
Earlier, we pointed out that, even though the number of server positions is expected to decline between now and 2032, there is still a high number of open positions available each year. This highlights the high turnover rate in the position—and across the restaurant industry as a whole.
Across the restaurant industry, the average employee turnover is 110 days. Back-of-house positions tend to turn over at a slightly higher rate than front-of-house positions, with 43% and 41% one-year turnover rates respectively. (“One-year turnover rate” means the percentage of employees who leave a job within one year of starting.)
When it comes to the reasons why people leave their restaurant jobs, pay leads the pack; 34.6% of employees said their wages were the reason they left / planned to leave their job.
(source)
Restaurant and Foodservice Earnings Statistics
Average Earnings Among All Foodservice Workers
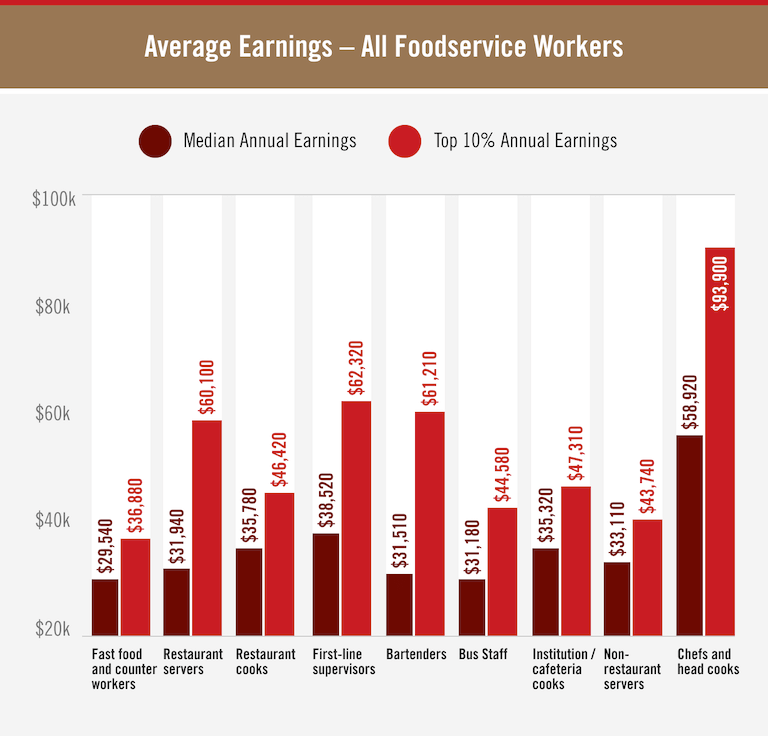
Compensation can vary widely for employees in different foodservice positions.
Chefs and head cooks have the highest median and top 10% annual earnings ($58,920 and $93,900 respectively) of nine major positions in the industry.
Among other back-of-house positions, restaurant cooks had the highest median annual earnings ($35,780), but institution / cafeteria cooks had the highest top 10% earnings ($47,310).
For customer-facing employees, first-line supervisors had the highest median and top 10% annual earnings ($38,520 and $62,320 respectively).
Among other customer-facing positions, non-restaurant servers had the highest median earnings ($33,110), but bartenders had the highest top 10% earnings ($61,210).
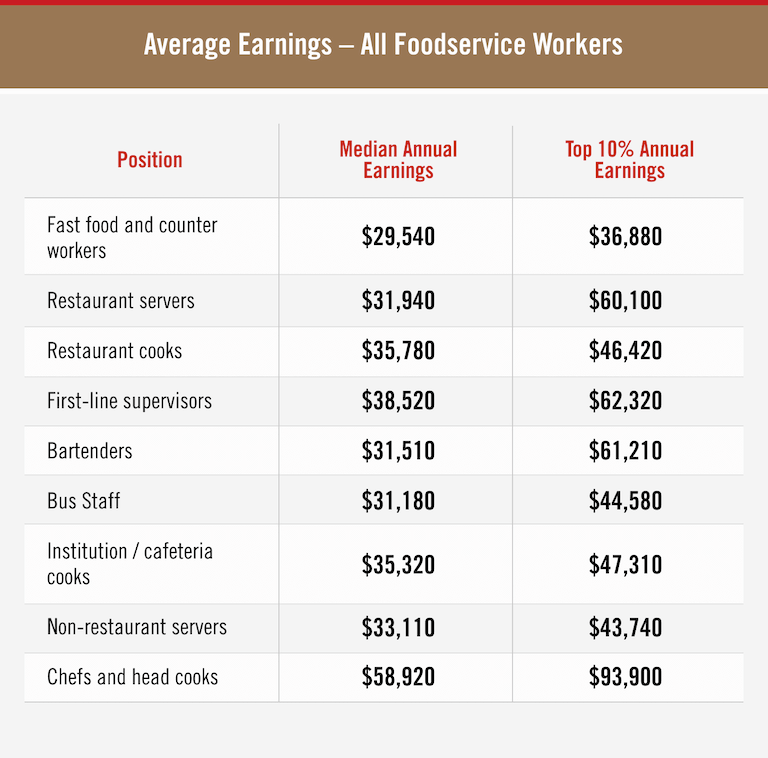
(source)
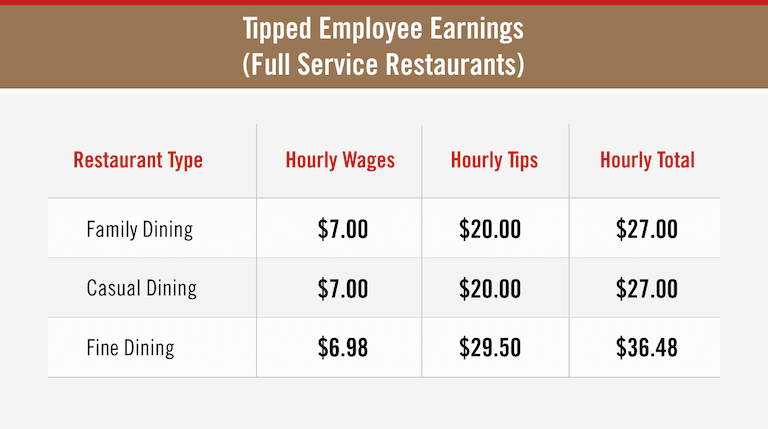
Average Earnings for Tipped Employees at Full-Service Restaurants
In 19 states, tipped workers earn a minimum cash wage of $2.13 per hour; this amount has not increased since 1991. Only 7 states (Alaska, California, Minnesota, Montana, Nevada, Oregon, and Washington) require employers to pay tipped employees the full state minimum wage regardless of how much they earn in tips.
When it comes to tipped employees’ earnings, the type of restaurant they work at can matter. Tipped employees at family dining and casual dining restaurants earn an average of $27/hour, averaging $7/hour in wages and $20/hour in tips.
Meanwhile, tipped employees at fine dining restaurants earn an average of $36.48/hour, averaging $6.98/hour in wages and $29.50/hour in tips.
While average hourly wages are largely the same among tipped employees at different types of restaurants, employees at fine dining restaurants earn 47.5% more in tips per hour.
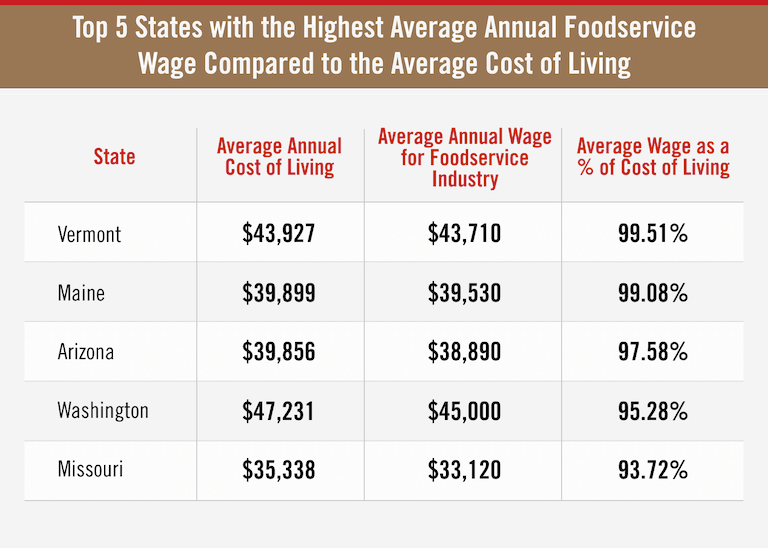
Data suggest that it may be difficult for foodservice workers to make ends meet. Escoffier compared the average annual wage for foodservice industry workers in each state with the average annual cost of living in each state, and found that there is not a single state in the country where the average wage was higher than the average cost of living.
