The restaurant and foodservice industry is not only one of the largest in the United States, it’s also one of the most diverse.
Generally speaking, both restaurant owners and restaurant employees represent more diverse populations than the broader economy—though the details paint a slightly more complex picture.
We compiled data on restaurant industry demographics from sources such as the U.S. Census Bureau, reports from the National Restaurant Association, and third-party industry surveys to provide a detailed view of the demographic makeup of restaurant employees and owners across racial, gender, age, and educational dimension, adjusted for population diversity in each state.
In doing so, we can see a nuanced snapshot of how the restaurant industry mirrors—and often surpasses—national trends in diversity across ownership and workforce demographics.
Let’s take a look at the numbers.
Demographics of Restaurant Owners
On the whole, restaurant owners are a more diverse group than business owners in the broader private sector. As we dig into the numbers, the data will reveal that rates of restaurant ownership by women and minorities are actually closely aligned with the diversity of the country, while those groups are not as well represented in the economy as a whole.
Racial Demographics of Restaurant Owners
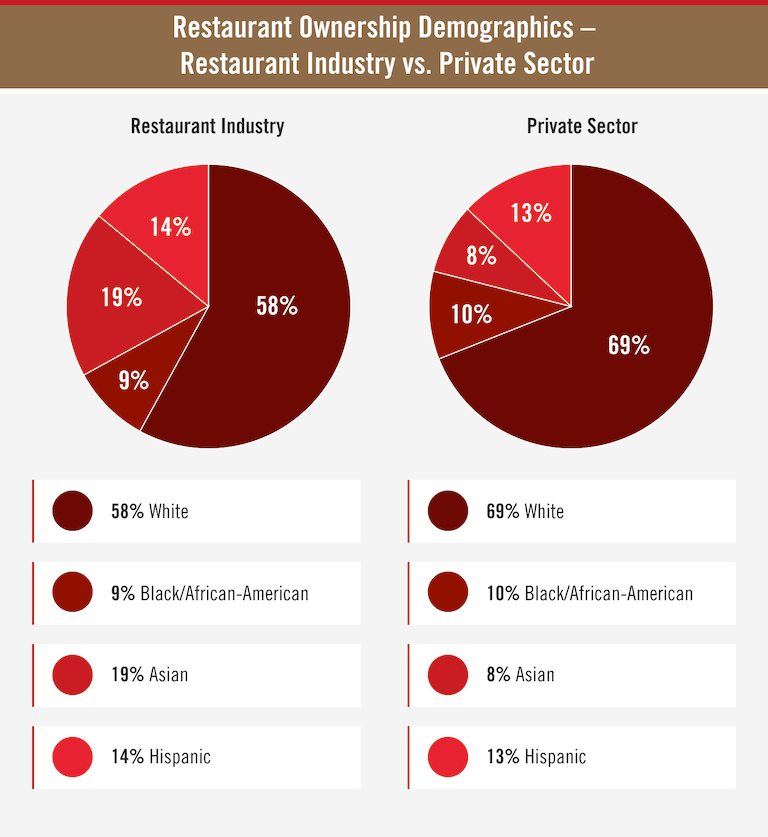
According to the National Restaurant Association, more than 4 in 10 restaurants are minority-owned—in the private sector overall, only 3 in 10 businesses are minority-owned.
However, a look at the numbers will reveal that this trend is not equally true for all minority populations.
While business ownership is roughly the same between the restaurant industry and the private sector for both Black/African-American and Hispanic populations, the percentage of restaurants owned by the Asian population is more than double the percentage of businesses owned by that group in the private sector as a whole. This means that the elevated rate of minority-owned restaurants is almost exclusively on account of the elevated rate of restaurant ownership within this one population.
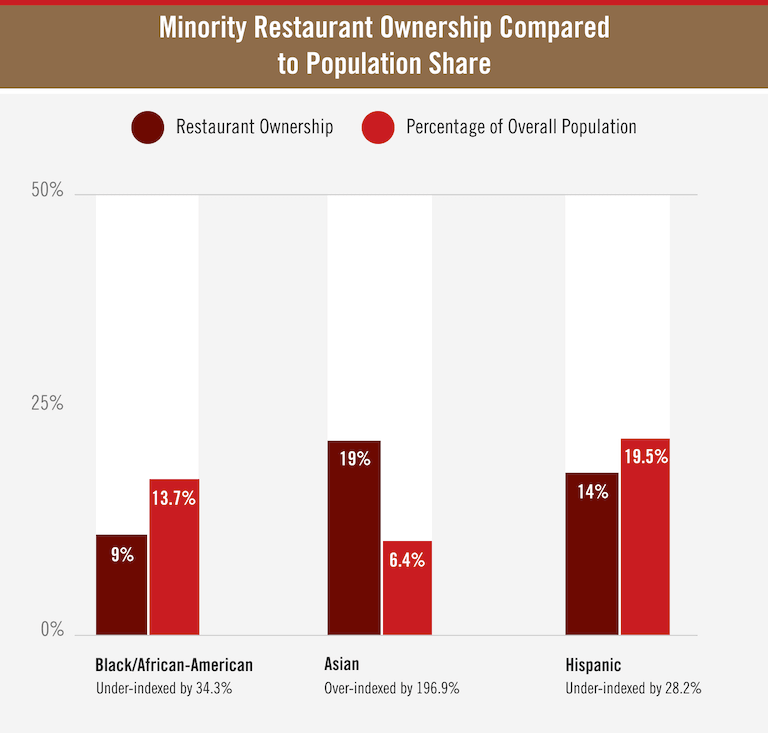
A look at the country’s broader racial demographics makes this trend even more stark.
Escoffier found that, while Black/African-American and Hispanic populations are both underrepresented compared to their share of the population by roughly 30% (34.3% and 28.2%, respectively), the Asian population is overrepresented by 196.9%—meaning that this population makes up nearly three times the share of restaurant owners compared to its share of the overall population.
Top 10 States with the Highest Proportion of Minority-Owned Restaurants
- Hawaii (64%)
- Texas (59%)
- California (58%)
- Georgia (55%)
- Maryland (54%)
- Florida, Mississippi (49%)
- Nevada (47%)
- New Mexico (46%)
- Virginia (44%)
However, these numbers don’t tell the whole story; a glance at the states at the top of the list—Hawaii, Texas, and California—reveals that these are among the most diverse states in the country, with the highest proportions of non-white residents. So it’s not surprising that they should have high levels of minority-owned restaurants.
In fact, given Hawaii’s extremely high non-white population (78.4%), Hawaii’s 64% minority restaurant ownership rate means that it is actually one of the states with the lowest rate of minority-owned restaurants compared to its population demographics.
If we compare minority restaurant ownership to the non-white population in each state, the data tell a different story.
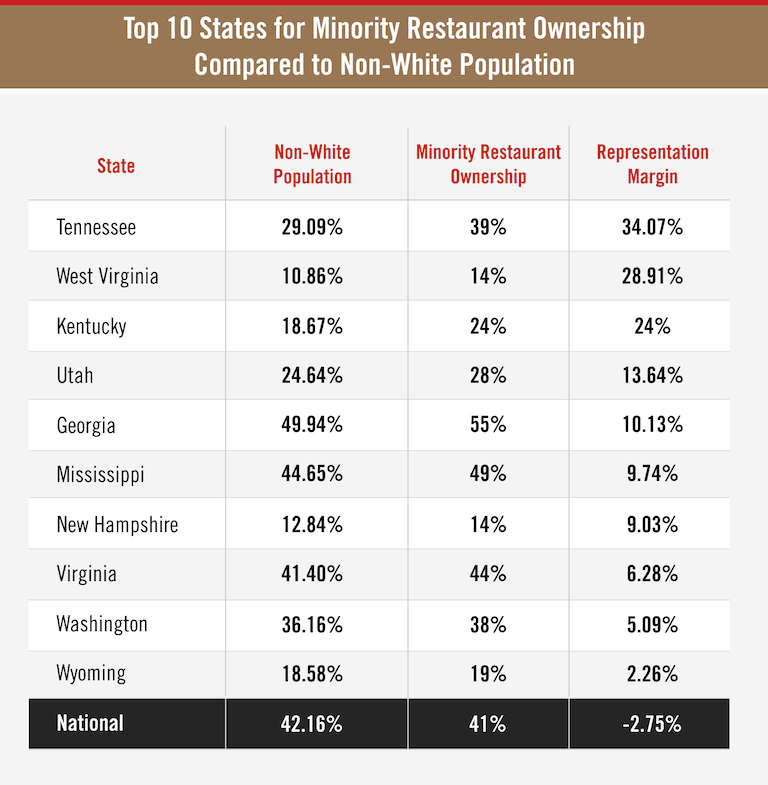
Looked at through this lens, Tennessee is the state with the highest level of minority restaurant ownership relative to its minority population; the rate of minority restaurant ownership is 34.07% higher than the state’s minority population. There seems to be a regional trend here as well, with six of the top ten states located in the South.
Interestingly, Escoffier’s analysis found that the national rate of minority restaurant ownership (41%) closely matches the national non-white population (42.16%), indicating that restaurant ownership is actually broadly reflective of the diversity of the country as a whole.
Gender Demographics of Restaurant Owners
Similarly, when it comes to women-owned businesses, the restaurant industry is more reflective of women’s share of the total population than the broader private sector is.
Almost half (47%) of all restaurants are at least 50% women-owned—compared to 43% of businesses in the private sector overall. However, given that, according to data from the U.S. Census Bureau, women make up 50.52% of the total population, women are still underrepresented in restaurant ownership—even if the industry is substantially more inclusive than the broader private sector.

Certain states stand out as having particularly high rates of restaurants that are at least 50% owned by women.
Top 11 States with the Highest Proportion of Women-Owned Restaurants:
- Montana (62%)
- Wyoming, New Mexico (57%)
- North Dakota, South Dakota, Mississippi (56%)
- Oregon (55%)
- Alaska, Georgia, Idaho, Washington (54%)
As we did with the racial demographics, we can also compare these ownership numbers to state-by-state gender demographics to reveal more insights.
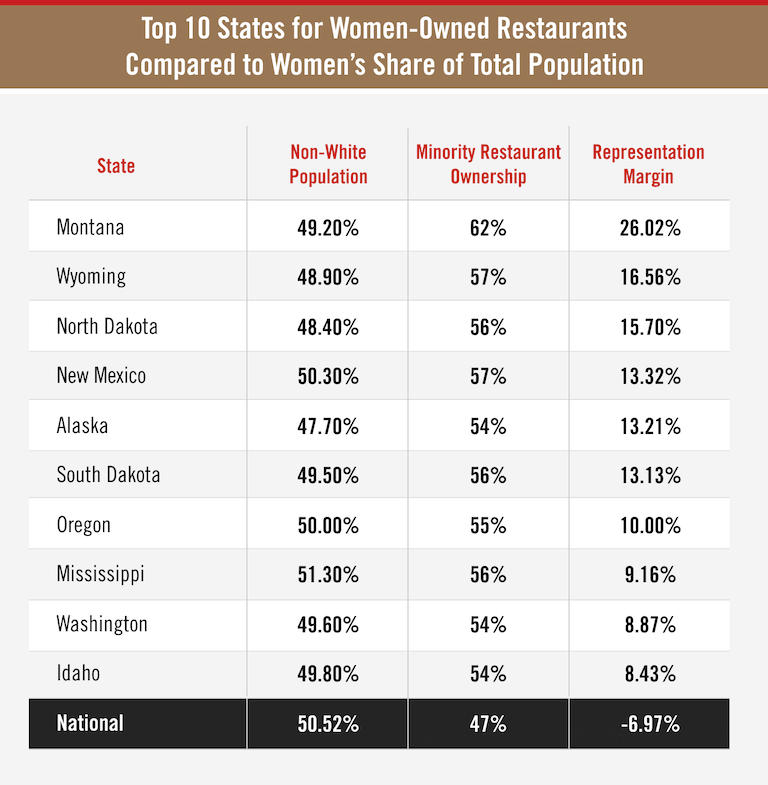
This list is largely the same as the previous list (owing to the fact that gender demographics vary less from state to state than racial demographics do). However, it’s interesting to note the scale of women’s representation in these states—especially compared to women’s underrepresentation in the nation as a whole.
It’s worth noting the regional trend that emerges here, too—seven of the ten states form a contiguous band, from the Dakotas westward to Washington and Oregon.
Also, Mississippi, Wyoming, and Washington appear on both lists, suggesting that these are the states with the most diverse restaurant ownership in the country.
Demographics of Restaurant Employees
As we saw with restaurant owners, restaurant employees are, by most major measures, a more diverse group than the broader labor force as well. And there are a number of indications that this group may be more diverse than the broader population, too.
Let’s break down the data to get a better understanding of restaurant employee demographics.
Racial/Ethnic Demographics of Restaurant Employees
50% of restaurant employees belong to a minority racial/ethnic group, compared to 41% in the rest of the labor force. Recall that the nation’s non-white population is 42.16%—revealing that the diversity of the total labor force is closely aligned with the diversity of the total population, while the restaurant workforce is significantly more diverse than the population at large.
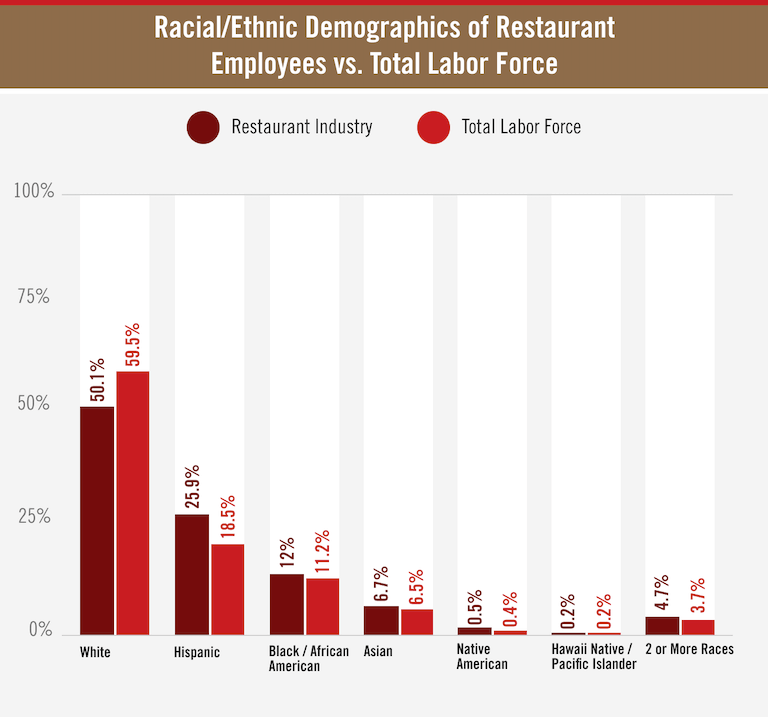
We can also examine data for several major restaurant industry job roles to reveal racial/ethnic diversity on a more granular level.
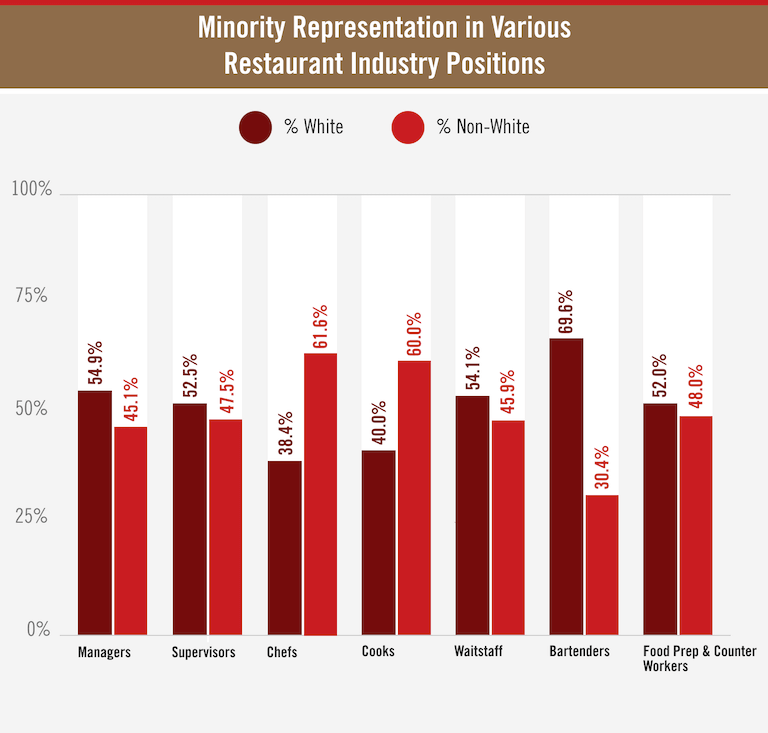
Escoffier found that non-white representation exceeded the national average in six of seven major restaurant industry positions; bartender was the only position that was less diverse than the broader population.
The data also revealed that 45% of managers belong to a minority racial/ethnic group—the highest proportion of minority managers of any other sector of the economy.
Gender Demographics of Restaurant Employees
54% of restaurant employees are female, as opposed to 47% in the overall labor force. Considering that, according to the U.S. Census Bureau, women make up 50.52% of the population, we can see that, while women make up a comparatively smaller share of the total labor force, they make up a comparatively larger share of the restaurant industry workforce.
(Note that, at the time of this analysis, no reliable data was available as to the proportion of non-binary employees in the restaurant industry; as such, this analysis limited itself to the data available.)

As we did with racial/ethnic demographics, we can examine the gender breakdown of various restaurant industry positions to shed more light on the makeup of the workforce.
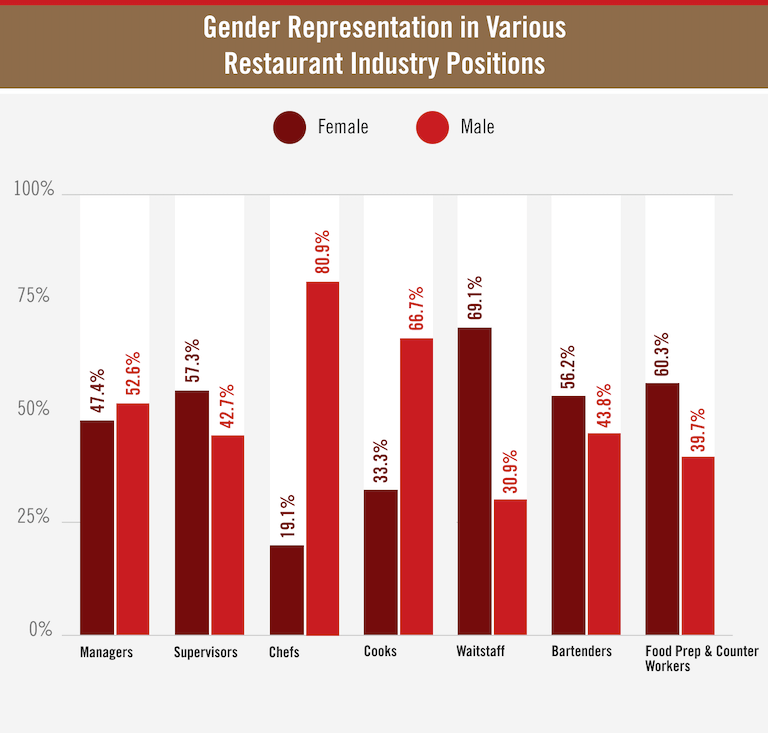
The data reveal that women are well represented in front-of-house positions, but are significantly underrepresented in back-of-house positions—only 33.3% of cooks and 19.1% of chefs are women.
Age Demographics of Restaurant Employees
The restaurant industry’s workforce tends to skew much younger than the total workforce. 40% of restaurant employees are under the age of 25, and 60% are under the age of 35; compare that to 13% and 35%, respectively, for the labor force overall.
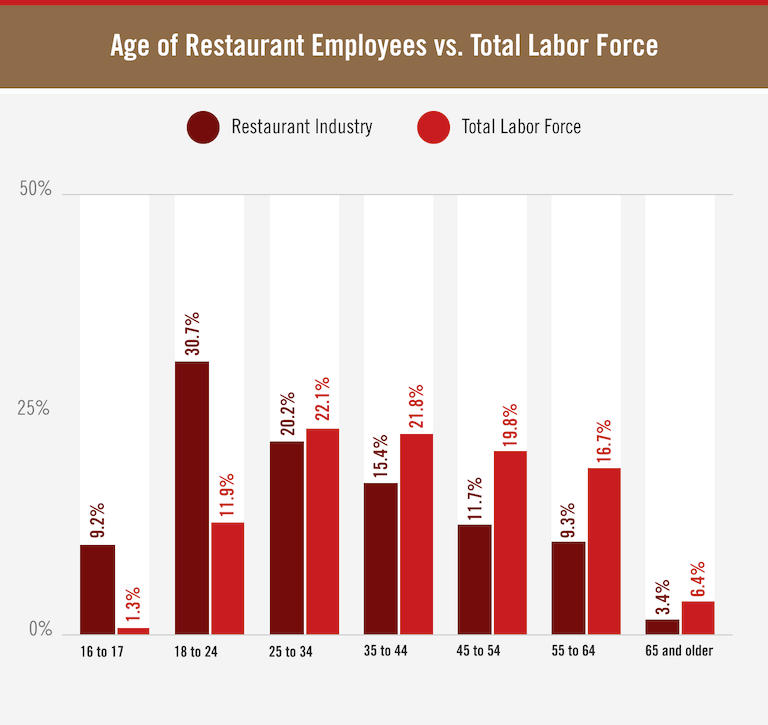
Digging into the position-level data reveals some interesting insights about which age groups tend to fill which positions.
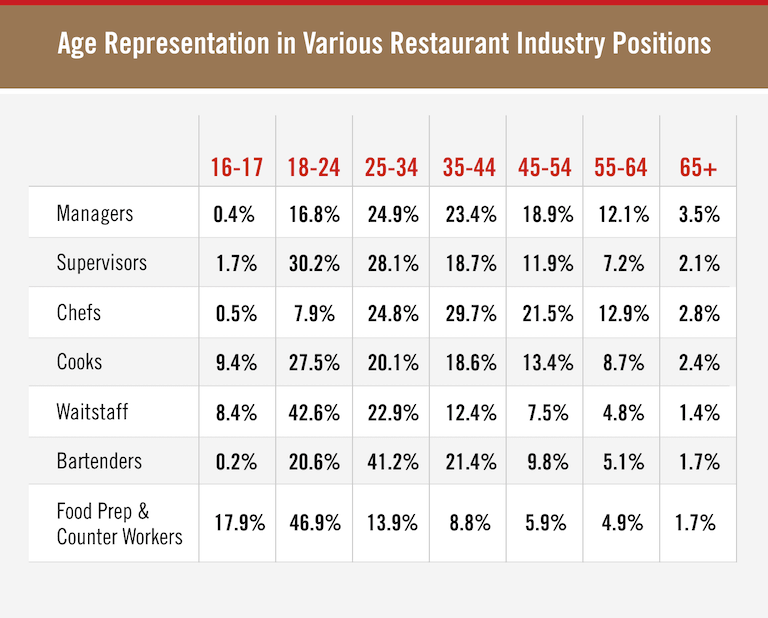
The most common positions for employees under 25 are food preparation & counter workers and waitstaff, with 64.8% and 51% of these positions filled by that cohort, respectively. Which, logically, makes sense—that younger workers would be more likely to fill these frontline positions.
On the flipside, the most common positions for employees 55 and older are chef and manager, with (respectively) 15.7% and 15.6% of these positions going to people in that age group. This, too, makes logical sense—that employees over the age of 55 would be most likely to hold higher-ranking positions with more responsibility.
Education Demographics of Restaurant Employees
Restaurant employees tend to have lower levels of educational attainment than the total labor force—partially owing to the fact that people in this industry are more likely to be young and still enrolled in school.
Let’s take a look at the data that back up this observation.
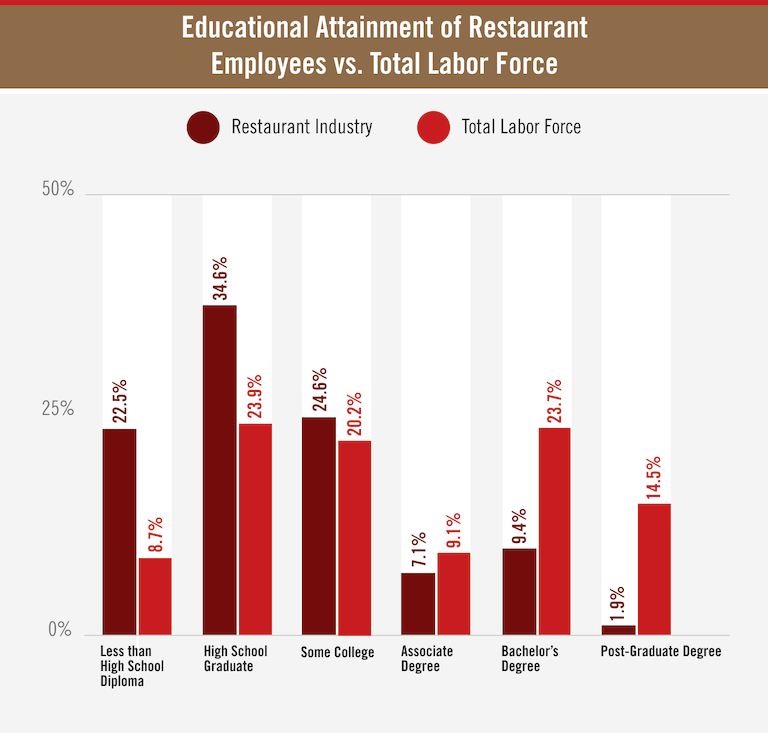
Looking at the total labor force, 67.5% of workers have attained some education after high school, compared to 43% of restaurant workers.
However, as mentioned above, this is largely on account of the fact that restaurant workers are much more likely to be currently enrolled in school than workers in general—more than a quarter (26.9%) of restaurant employees are currently enrolled in school, compared to less than 10% of the total labor force.
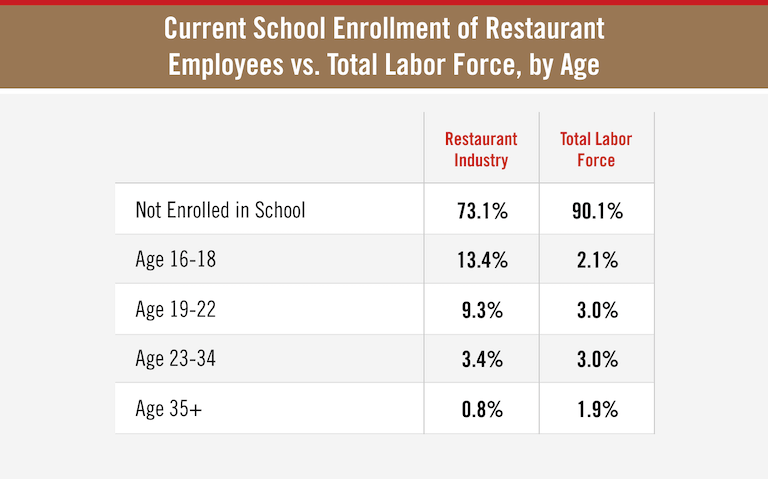
These data reveal that 22.7% of all restaurant employees are people between the ages of 16 and 22 who are currently enrolled in school—likely in high school or some form of post-secondary education—which highlights the fact that many people working in this industry are also actively working toward an education at the same time.
(source)

