
America is a nation of many cultures—and perhaps nowhere is this more apparent than in the diversity of our food scene.
But which American cities can claim the title for the most diverse cuisine? We analyzed data on the various types of national cuisines available in the nation’s largest cities in order to find out.
But before we dive into our results, and the methodology we used to obtain them, let’s have a glance at some of the key findings. (Jump down to see our methodology)
America’s Most Diverse Food Cities – Key Findings
- San Francisco is the nation’s most diverse food city – not only is its food scene more diverse than any other city, but that diversity is very dense, with a high level of diversity for a relatively small population.
- At the other end of the spectrum, Detroit was the least diverse food city out of the 38 largest cities we surveyed; nearly two-thirds of its restaurants are classified as “American” (as opposed to some other national cuisine).
- The nation’s two largest states each had six cities on the list, but one was clearly more diverse: California’s six cities placed tenth on average, and included two cities in the top five; Texas’ six cities ranked twenty-sixth on average, and included two cities in the bottom five.
How Diverse Is the Food Scene in America’s Largest Cities?
In order to determine the diversity of these cities, we gathered data on the different types of national cuisines represented by restaurants in America’s thirty-eight largest cities (that is, cities with a population greater than 500,000 as of the 2020 census).
Then, we calculated the diversity of each city’s food scene relative to its population density and to the geographical density of its restaurants in general.
In doing so, we obtained these results.
America’s 38 Largest Cities, Ranked by Diversity of Food Scene
| Rank | City | Score |
|---|---|---|
| 1 | San Francisco | 100.00 |
| 2 | New York City | 92.58 |
| 3 | Seattle | 91.69 |
| 4 | Washington, DC | 83.08 |
| 5 | Los Angeles | 82.62 |
| 6 | San Jose | 82.43 |
| 7 | Portland, OR | 81.62 |
| 8 | Chicago | 77.99 |
| 9 | Las Vegas | 76.66 |
| 10 | Boston | 76.36 |
| 11 | Philadelphia | 75.91 |
| 12 | San Diego | 68.26 |
| 13 | Sacramento | 67.65 |
| 14 | Baltimore | 67.43 |
| 15 | Austin | 63.78 |
| 16 | Denver | 63.76 |
| 17 | Houston | 62.86 |
| 18 | Charlotte | 61.78 |
| 19 | Milwaukee | 60.04 |
| 20 | Columbus | 58.44 |
| 21 | Atlanta | 57.65 |
| 22 | Jacksonville | 51.41 |
| 23 | Fresno | 49.35 |
| 24 | Dallas | 47.57 |
| 25 | Albuquerque | 46.56 |
| 26 | Mesa | 43.29 |
| 27 | Kansas City, MO | 42.24 |
| 28 | Tucson | 40.59 |
| 29 | San Antonio | 39.57 |
| 30 | Indianapolis | 38.57 |
| 31 | Phoenix | 36.07 |
| 32 | Oklahoma City | 36.01 |
| 33 | Nashville | 34.42 |
| 34 | Louisville | 32.07 |
| 35 | Fort Worth | 26.18 |
| 36 | El Paso | 25.08 |
| 37 | Memphis | 14.58 |
Some initial things jump out about this data. For one, many of the cities with the most diverse food scenes are coastal, including seven out of the top ten. This is consistent with the fact that coastal cities, on the whole, tend to have more diverse populations.
But looking at the data in the context of population diversity statistics, this is likely not the only explanation. While there may be some relationship between lack of diversity in both the population and the food scene—the bottom three cities on our list are also among the least diverse of large American cities (El Paso, 51 ; Memphis, 47; Detroit, 50)—the top three cities are all over the place: San Francisco is fourteenth, while New York City is third and Seattle is thirty-sixth.
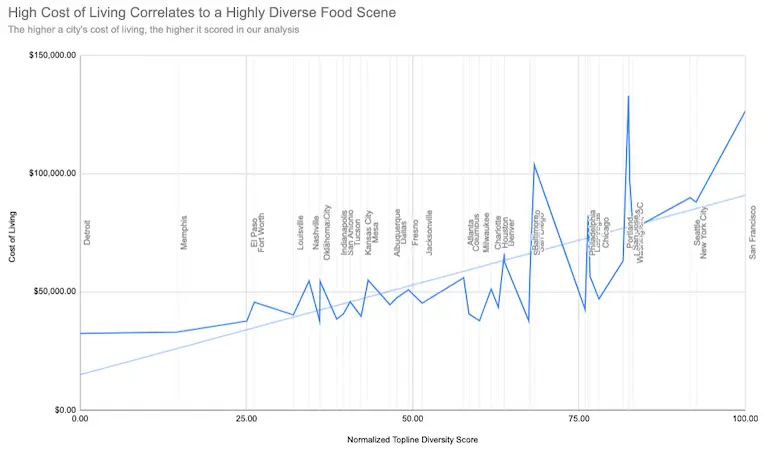
There’s actually a much more direct correlation between the diversity of a city’s food scene and its cost of living. Using data from the Bureau of Labor Statistics (BLS), we determined the cost of living for each city and found a strong relationship between these two factors—indicating that a diverse food scene may depend on the ability of residents to pay for it.
With that said, let’s take a closer look at the top five cities on our list.
Top Five Most Diverse Food Cities in America
1. San Francisco
- Population: 808,988
- Number of Restaurants: 2,793
- Diversity Index: 3.28/5.00
- Density Factor: 143.69
With the highest concentration of restaurants per capita of any major U.S. city, San Francisco packs an incredible amount of global culinary diversity into its compact forty-seven square miles.
2. New York City
- Population: 8,258,035
- Number of Restaurants: 7,182
- Diversity Index: 3.23/5.00
- Density Factor: 45.59
Each subway stop brings a new culinary world, from the Bengali flavors of Jackson Heights to the Italian traditions of Arthur Avenue to the West African restaurants of Little Senegal, making New York’s dining landscape as diverse as its 8 million residents.
3. Seattle
- Population: 755,078
- Number of Restaurants: 2,042
- Diversity Index: 3.17/5.00
- Density Factor: 81.08
From its famous Pike Place Market to the International District, Seattle’s compact urban core packs an impressive variety of dining options into a relatively small geographical area—it had one of the highest density scores of all cities we evaluated.
4. Washington, D.C.
- Population: 678,972
- Number of Restaurants: 1,481
- Diversity Index: 3.02/5.00
- Density Factor: 72.70
The city’s commitment to world-class dining is evident in its impressive collection of Michelin-starred restaurants—with more starred establishments per capita than many larger cities—while its small size means this international array of dining options is packed into an easily accessible area.
5. Los Angeles
- Population: 3,820,914
- Number of Restaurants: 5,210
- Diversity Index: 3.05/5.00
- Density Factor: 38.86
However, its sprawling nature actually cost it some points in our analysis; despite having a slightly higher diversity score than Washington, D.C., the fact that the nation’s capital condensed such diversity into such a small space gave that city the edge.
Methodology and Notes
To obtain these findings, we first identified the largest cities in America according to the 2020 US Census;1 we limited our analysis to cities with populations over 500,000, of which there are thirty-eight.
We then used Tripadvisor2 to identify the number of restaurants of various cuisines in each city. We selected forty-six distinct cuisines—forty-four national cuisines, plus Puerto Rican and Hawaiian cuisine (which are distinct and unique enough from “American” cuisine to merit inclusion).
We then calculated the diversity of each city’s food scene using the Shannon Diversity Index. (Note: We adapted these scores into a five-point scale in the article above for legibility; in our calculations, we used the raw index score for each city.)
We also calculated a density factor based on the population density (drawing on US Census data3) and restaurant density in each city, in order to give credit to cities that managed to have high diversity relative to their size (both population and geographical).
We then normalized the diversity and density scores, combined them into a weighted score, and normalized that score to obtain our topline ranking.
One caveat: Because we obtained restaurant cuisine types from Tripadvisor, those results can only be as accurate as the TripAdvisor cuisine type tags are. However, if we assume that their level of accuracy is consistent across all cities, then we can at least be confident in our comparison of cities.
These findings show how restaurant diversity varies across the United States, with people from coast to coast putting a high premium on diverse culinary options.
Sources
- (1) United States Census Bureau, City and Town Population Totals: 2020-2023
- (2) Tripadvisor, Total restaurants and restaurants by national cuisine type
- (3) United States Census Bureau, Annual Geographic Information Table